Building Trading Histories - the Matrix Analyzer
One of the most common questions that new users of Sentient Trader ask is "can I back-test the software?"
The answer is, "Yes, sort of". You can perform something similar to back-testing, by building a Trading History .
Distinction between Back-Testing and Building a Trading History
There is a distinction that you should understand between the back-testing process performed by many technical analysis programs and the trade building process used by Sentient Trader, and that brings us back to the different analysis process that Sentient Trader uses:
The analysis process used by Sentient Trader is not purely mathematical, it is a pattern-recognition process.
The correct way to perform back-testing of any trading process is to step through the data one bar at a time and mimic the process one would do in real time:
- Perform an analysis, and;
- Make trading decisions.
When the analysis is purely mathematical (for instance making a trade when price crosses a moving average) then one can perform back-testing simply by looking back at the chart and identifying where price crossed the moving average, and therefore when trades would have happened. However when the analysis is not purely mathematical (as is the case with Sentient Trader) then one has to step forward one bar at a time and perform the analysis using only the information available up to that bar. Doing this on a bar-by-bar basis with Sentient Trader would take a very long time, and so Sentient Trader uses a speeded-up process which makes one assumption that it is important to understand:
Sentient Trader assumes that the troughs of the trading cycle which are further than one full cycle in the past have been correctly phased
Why did we do this?
Sentient Trader is NOT automated trading software. It must be used by someone who is able to judge the analysis, improve upon the analysis where necessary and filter the trading process through their knowledge and experience.
In the hands of such a person Sentient Trader will perform very similarly to the way that it performs when building a trading history. This is because someone with even a very basic understanding of Hurst's Cyclic Principles is able to identify the position of a trough a full cycle in the past, and that is all that is happening during the trade history building process.
Simply stepping forward bar-by-bar through a data series is not a valid way of "back-testing". Because you are a vital part of the process. Sentient Trader requires your knowledge and experience to achieve extraordinary results. We will say it again: Sentient Trader is not automated trading software.
This single assumption enables Sentient Trader to speed up the analysis considerably, but you might wonder why, if the process is not 100% accurate, you should bother doing it at all? This is a very important point:
In Sentient Trader the building of trading histories is used primarily to reveal the character of the market, NOT to provide objective evidence that the system works.
That is a really important point. The building of trading histories reveals the character of the market, a tremendously important aspect of the Sentient Trading methodology. It is not used to provide evidence that the trading method actually works. That evidence is provided by constant real-time tests that we perform. Real-time testing is the only way that true evidence can be produced because you, the user are an integral part of the winning Sentient Trader formula.
Building Trading Histories
The actual process of building trading histories in Sentient Trader is very simple. Here is the recommended approach:
- Set up your chart.
- Build a trading history using a FULL trading matrix.
- Analyze the Trading Report to get an understanding of the character of the cycle you are trading.
- Adjust the Trading Matrix to suit the character of the cycle.
- Build a new trading history using the adjusted Trading Matrix.
Setting up your Chart
It probably goes without saying, but I'll say it anyway - there is no point building a trading history on a chart which has incorrect trading settings, or tick values, or the wrong cycle!
In setting up your chart make sure that you have the set up the Trading Settings correctly:
Tick value, or minimum price fluctuation.
Monetary value of one tick (how much is the minimum price move actually worth per lot/share/contract)
Trading enabled: Is the chart enabled to trade long and short?
Equity: is there enough money to trade?
Percentage risk: what percentage of the equity will be risked per trade? You can do a rough estimate of whether your settings are OK by working out how many contracts would be traded in an average situation:
- Look at price movement and work out an approximate risk amount of about a quarter of the average price range of the cycle you will be trading. Call this price range the risk amount.
- Divide that risk amount by the minimum tick value (minimum price fluctuation). This is the number of points risked.
- Multiply the number of points risked by the monetary value of one tick. This is the total amount risked per share/lot/contract.
- Now work out the amount you are willing to risk, which is percentage of your equity that will be risked per trade (if your percentage of equity to risk setting is 2%, and your equity is $10,000 then the amount you are willing to risk is $200).
- Now how does the total amount risked per share/lot/contract compare to the amount you are willing to risk? Divide the amount you are willing to risk by the total amount risked per share/lot/contract to work out how many shares/lots/contracts you can afford.
- If the number is less than one, then you cannot afford to trade with your current settings! Adjust the equity, the monetary value of one tick, the percentage equity you are risking, or apply leverage.
Trading Cycle: make sure that you have the correct trading cycle selected. Note that if you are using the Sentient Trading Methodology:
- There must be three cycles shorter than the trading cycle (which have been phased) for decisions to made correctly. This means that the shortest cycle that you can trade using this methodology on EOD charts is the 40-day cycle, and on 1-minute Intraday charts the 30-minute cycle (depending of course on the nominal model you are working with).
- Those three shorter cycles must all have harmonic ratios of 2:1 to the cycles longer than them (this restriction will be overcome shortly, but at present it does apply).
- There must be two cycles longer than the trading cycle (which have been phased) for decisions to made correctly.
- The harmonic ratios of these longer cycles do not need to be 2:1, but it is recommended.
Ensure that the Allow Sentient Trader to adjust the trading cycle setting is NOT enabled (because you want to build a trading history for a specific cycle).
Make sure that the trading will be conducted according to the methodology you prefer (Sentient Trading Methodology or Hurst Methodology) from the Trading menu.
Build a Trading History using a FULL Trading Matrix
The Trading Matrix is used by the Sentient Trading Method, not by Hurst's Trading Method, and so if you are using the latter method then you needn't bother with the Trading Matrix, simply go ahead and build your trading history.
A FULL trading matrix is one that will allow trades on each and every one of the four trading waves, under all conditions of underlying trend (and it is a good idea to force trades by ignoring the profit potential of the waves). Here is what your matrix should look like:
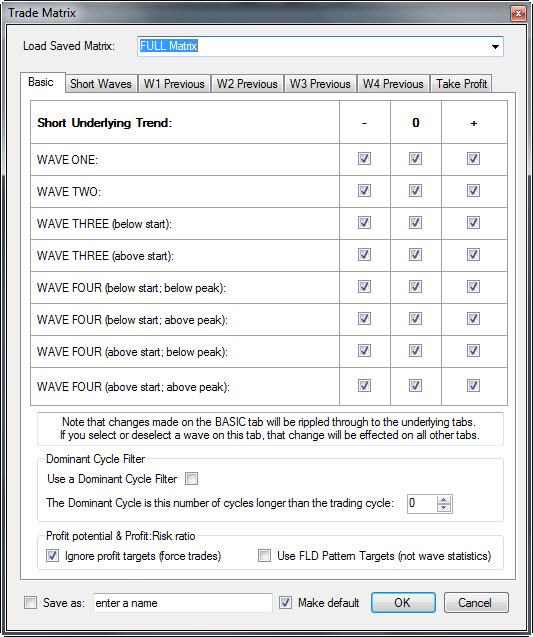
This is NOT a sensible way to trade, and it might seem an odd thing to do because it negates the whole theory of the Sentient Trading methodology. The reason we do it is to reveal the character of the market by actually trading every single wave under all conditions of underlying trend, and thereby seeing which waves are profitable under which conditions of underlying trend.
Having set up your full matrix, use the menu Trading > Matrix Analyzer to start building the trading history. Sentient Trader will ask you whether you would like clear the trading journal of the chart. Because the trading journals are usually the biggest (memory demanding) parts of saved workspaces, this is usually a good idea. In any case previous journal entries are likely to be of no interest to you.
Then Sentient Trader will present you with a box which has the start date for the history building process selected and also an end date. It is recommended that you accept the defaults, but you could select a later start date if you are adding to a trading history that is already present on the chart (such as if you are doing this every week on an intraday chart). It is not recommended that you select an earlier date, because Sentient Trader doesn't have enough information to perform an analysis or make any trading decisions before the bar that it selects as the starting point.
Click on the OK button, and Sentient Trader will step through the data bar-by-bar and build the trading history.
Helpful Hint: note that if you turn off cyclic elements such as FLD's, VTL's, projection boxes and so forth then the process will speed up. One of the slowest aspects of building a trading history is redrawing the chart every bar!
Analyze the Trading Report
When Sentient Trader finishes building the trading history you should save the workspace. I would recommend also using the File > Save As menu to give your workspace a new name, so that you save the results of trading with a full matrix for posterity. Then take a look at the Trading Report by using the Tools > View Trade Reports menu.
At this point you are not interested in the overall performance, in fact it is unusual for a full trading matrix to produce good results at all. What you are interested in is getting an understanding of the character of the market by observing the trading results of the four waves of your trading cycle under different conditions of underlying trend. You do that by taking a look at the Sentient Wave section of the Trading Report.
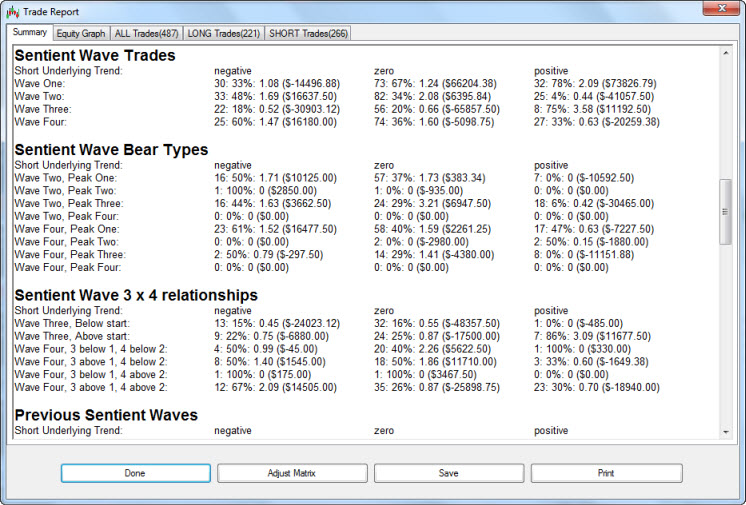
You will see in the above example that the character of this market is as expected according to the logic of the Sentient Trading methodology. What do I mean by this?
- Long trades (wave one and three trades) taken under conditions of a negative underlying trend LOSE money.
- Long trades (wave one and three trades) taken under conditions of a positive underlying trend MAKE money.
- Short trades (wave two and four trades) taken under conditions of a negative underlying trend MAKE money.
- Short trades (wave two and four trades) taken under conditions of a positive underlying trend LOSE money.
This makes logical sense, and so we have answered an important question about the instrument you are considering trading:
Will Sentient Trading work for this instrument : YES
If the Sentient Wave results are not logical then it is best to find another instrument to trade, because this breakdown of the logic indicates that there is something fundamentally wrong with the instrument, such as:
- The analysis should be inverted (synchronized peaks instead of troughs). This is often the case with commodities.
- The price movement is simply not cyclical enough. How can this happen? Most usually this happens with instruments that are very thinly traded. Cycles become evident as soon as there are a large number of market participants trading an instrument.
Is it worth testing a different cycle? Sometimes yes, but generally the answer is no. The reason for this is that because there are many cycles working together to produce the price movement, the "cycle system" is a fractal. If it fails on one level it will probably fail on all levels and time frames, although of course longer time frames would include more trading activity, and so sometimes a longer cycle performs better.
Adjust the Trading Matrix
Now click on the Adjust Matrix button of the Trading Report, and you are presented with the matrix that was used to build the trading history. You can edit this matrix, to select the profitable waves and underlying trend conditions as revealed in the Trading Report.
A word of caution: the Sentient Trading matrix has a multitude of settings. But don't be seduced by that. Avoid being too specific with your matrix, because you will begin to "curve fit" the matrix to the very specific data series that has been used to build the trading history. As a general rule we recommend only adjusting the basic matrix (the first tabbed page of the matrix) initially, and perhaps refining things later as you become more comfortable with the market you are trading.
Having adjusted the trading matrix, click on the OK button and Sentient Trader will build a new Trade Report, filtering out the trades that are no longer included in the revised matrix. Note that this is an approximate process, which is why we recommend the next step (building a new trading history). Note that the Adjust Matrix button at the foot of the Trade Report has changed to Save to Chart .
Once you are happy with the results as presented in the trading report, based on your revised trading matrix, click on the Save to Chart button. This does three things:
- All trades on the chart that do not match the new matrix are removed.
- If there is an open trade that does not match the new matrix it is also removed.
- The Sentient Trading matrix of the chart is replaced with the new matrix.
Note that the trading history as it now stands is only an approximation of the trading that would have been performed with that trading matrix, because different trading decisions are made by Sentient Trader if there is an existing open trade (which might not have been taken under the new matrix). For that reason it is important to perform the final step in the process:
Build a new trading history
Now that you have saved the revised trading matrix to your chart you should build the trading history again, on the basis of the new matrix (bear in mind that adjusting the matrix is an approximate process).
First of all clear all trading information by using the menu Trading > Clear ALL trades, orders & action signals.
Then build a new trading history using the Trading > Matrix Analyzer menu.
This is an excerpt from the upcoming Sentient Trader user manual. Enjoy!
Sam Medwin
Comments